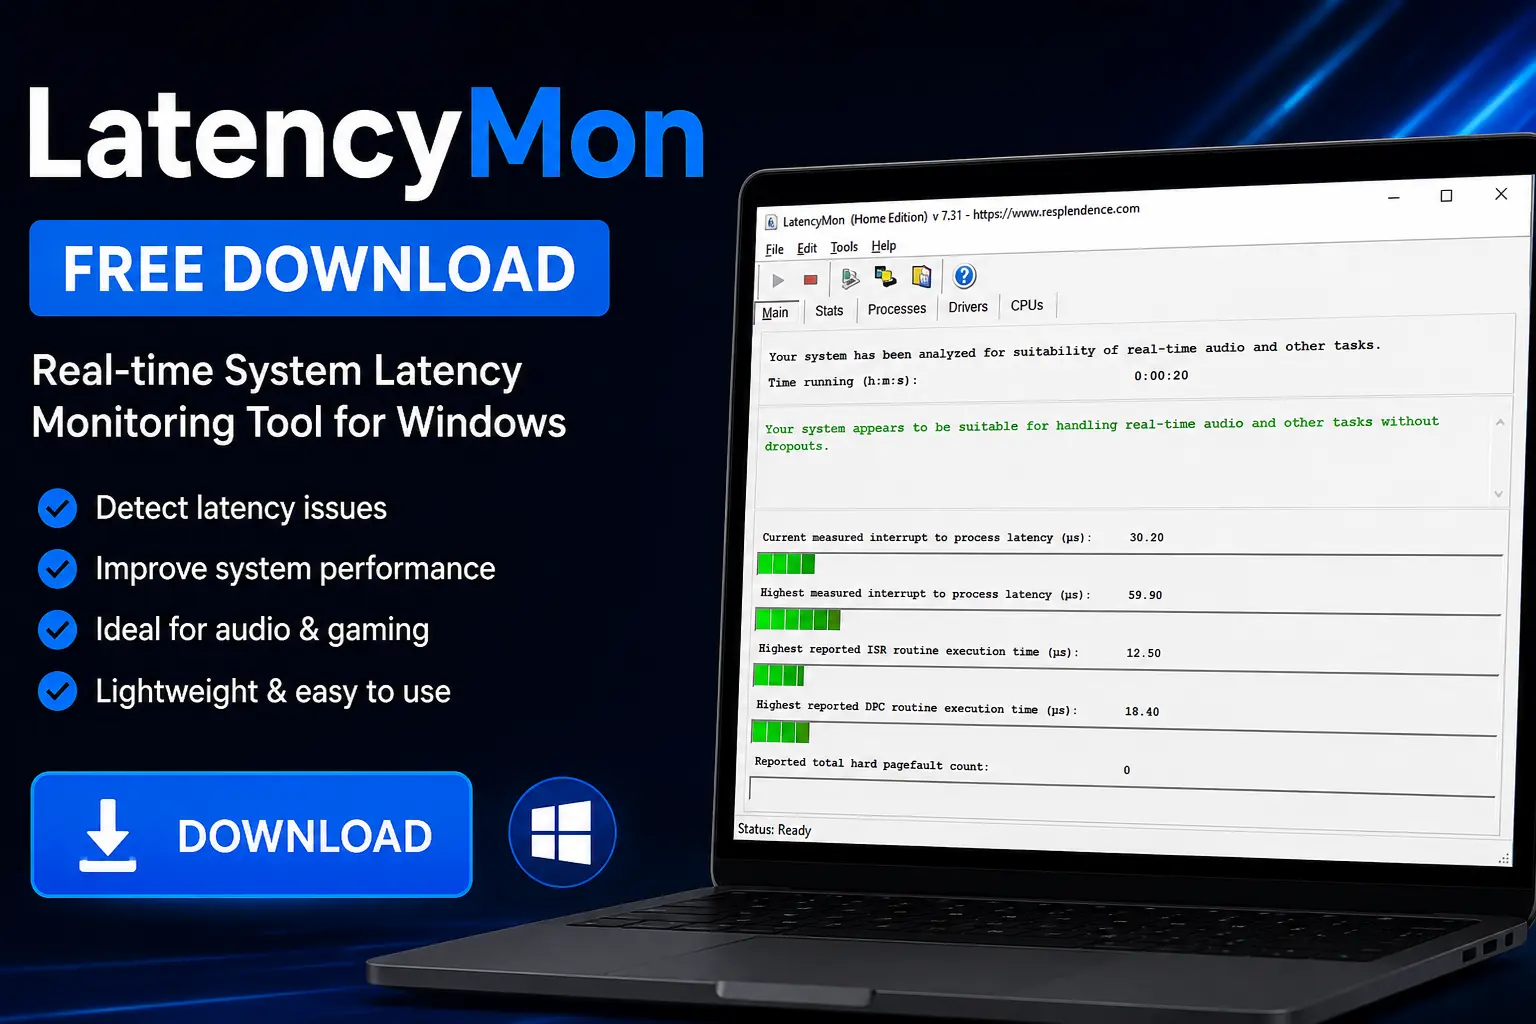
LatencyMon became the go-to free tool for this exact problem because it does one thing well: it shows you DPC and ISR execution times in plain numbers, without trying to be a full system-monitoring suite. Here's what the free version actually gives you and how to read its report correctly.
What the report actually shows you
The main numbers to watch are "Highest reported DPC routine execution time" and "Highest reported ISR routine execution time." Anything consistently above roughly 1ms for either is worth investigating; the driver list below ranks every driver by how much it has contributed.
Reading the report without overreacting
A single brief spike during a scan — especially right when you open a new app — is normal and not a sign of a real problem. What matters is a driver that shows up repeatedly across multiple scans under normal, idle-ish conditions.
What the free version doesn't include
The free build doesn't keep long-term historical logs or run scheduled background scans — for a one-time diagnosis, that's rarely a limitation that matters.